The Site Frequency Spectrum
This page describes the Site Frequency Spectrum (SFS), how to compute
its expectation using moments, manipulate spectra, implement demographic
models using the moments API, and computing and saving spectra from
a VCF.
If you use the SFS methods in moments in your research, please cite
[Jouganous2017] Jouganous, J., Long, W., Ragsdale, A. P., & Gravel, S. (2017). Inferring the joint demographic history of multiple populations: beyond the diffusion approximation. Genetics, 206(3), 1549-1567.
The SFS
A site-frequency spectrum is a \(p\)-dimensional histogram, where \(p\)
is the number of populations for which we have data. Thus, the shape of the SFS
is \((n_0+1) \times (n_1+1) \times \ldots (n_{p-1}+1)\), where \(n_i\)
is the haploid sample size in population \(i\). An entry of the SFS
(call it fs) stores the number, density, or probability for SNP frequencies
given by the index of that entry. That is, fs[j, k, l] is the number
(or density) of mutations with allele frequencies j in population 0, k
in population 1, and l in population 2. (Note that all indexing, as is
typical in Python, is zero-based.)
Examples
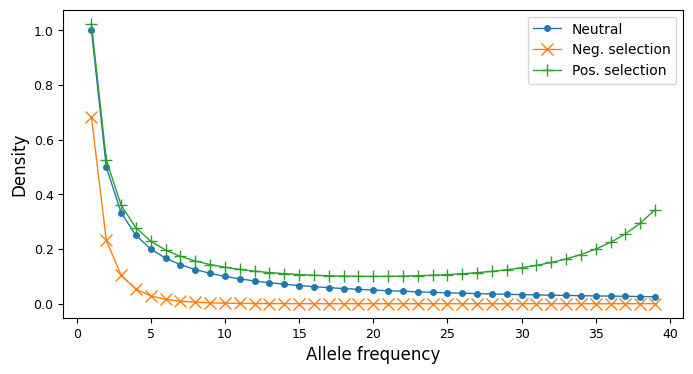
It can be helpful to visualize site-frequency spectra if you are new to working with them. In the single-population case, a SFS is a one-dimensional array. For variable biallelic loci and steady-state demography (no historical size changes, migrants, etc), the SFS is proportional to \(1/i\), with total size depending on the mutation rate and sequence length. Historical size changes and demographic events perturb the SFS from this shape, as does negative or positive selection, skewing the SFS to lower or higher frequencies, resp.
import moments
import numpy as np
import matplotlib.pylab as plt

sample_size = 40

# A neutral SFS
fs_neu = moments.Demographics1D.snm([sample_size])
# SFS under negative selection
fs_neg = moments.Spectrum(
    moments.LinearSystem_1D.steady_state_1D(sample_size, gamma=-10)
)
# SFS under positive selection
fs_pos = moments.Spectrum(
    moments.LinearSystem_1D.steady_state_1D(sample_size, gamma=10)
)

fig, ax = plt.subplots(1, 1, figsize=(8, 4))
ax.plot(fs_neu, ".-", ms=8, lw=1, label="Neutral")
ax.plot(fs_neg, "x-", ms=8, lw=1, label="Neg. selection")
ax.plot(fs_pos, "+-", ms=8, lw=1, label="Pos. selection")
ax.set_xlabel("Allele frequency")
ax.set_ylabel("Density")
ax.legend();
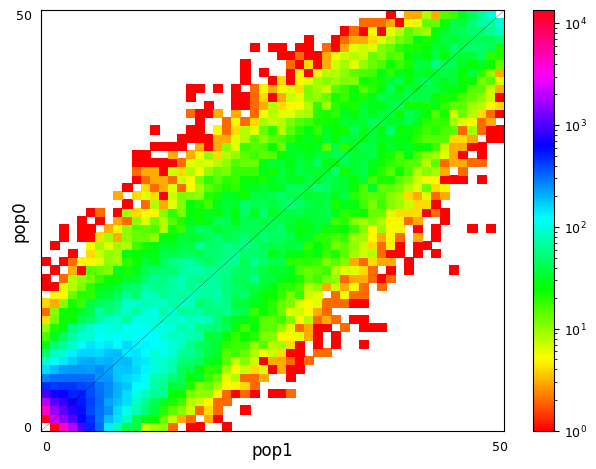
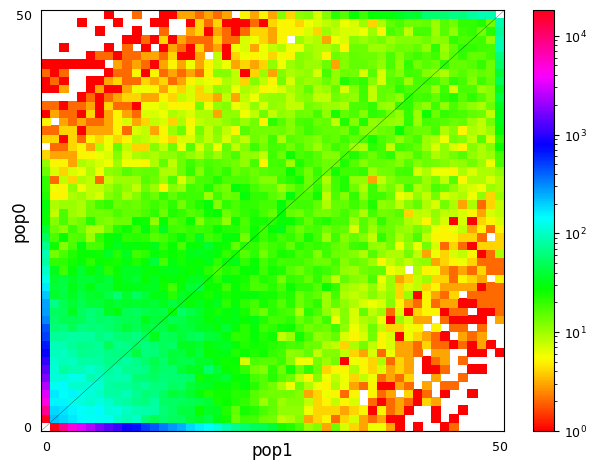
Multi-population SFS can be illustrated as multi-dimensional histograms, such as 2D heat maps. Here, we consider a very simple model of a population split and both derived populations are the same size as the ancestral population and do not exchange migrants. Allele frequencies in populations that split more recently will still be quite similar, while more distantly related populations are expected to have larger allele frequency differences.
sample_sizes = [50, 50]

# parameters of `split_mig` are (nu0, nu1, T, m)
# T is measured in units of 2Ne generations
fs_recent = moments.Demographics2D.split_mig((1, 1, 0.02, 0), sample_sizes)
fs_older = moments.Demographics2D.split_mig((1, 1, 0.15, 0), sample_sizes)

# assume theta = 20000, and then resample to fake data
fs_recent = (20000 * fs_recent).sample()
fs_older = (20000 * fs_older).sample()

moments.Plotting.plot_single_2d_sfs(fs_recent)
moments.Plotting.plot_single_2d_sfs(fs_older)
Spectrum objects in moments
SFS are stored as moments.Spectrum objects. If you are familiar with
dadi’s Spectrum objects,
then you already will know your way around a moments.Spectrum object.
moments has built off the dadi SFS construction, manipulation,
and demographic specification, with minor adjustments that reflect the
differences between the simulation engines and parameterizations.
Spectrum objects are a subclass of numpy.masked_array, so that standard
array manipulation is possible. Indexing also works the same way as a typical
array, so that fs[2, 3, 5] will return the entry in the SFS corresponding
to allele frequencies \((2, 3, 5)\) (here, in a three-population SFS).
Similarly, we can check if the SFS is masked at a given entry. For example,
fs.mask[0, 0] returns whether the “fixed” bin (where no samples carry
the derived allele) is ignored.
A Spectrum object has a few additional useful attributes:
fs.pop_ids: A list of population IDs (as strings) for each population in the SFS.fs.sample_sizes: A list of sample sizes (as integers) corresponding to the shape of the SFS.fs.folded: If True, the SFS is folded, meaning we polarize allele frequencies by the minor allele frequency. If False, the SFS is polarized by the derived allele.
Manipulating SFS
Along with standard array manipulations, there are operations specific to SFS. Some of these are equivalent to standard array operations, but we ensure that the masking and population IDs are updated properly.
Folding
Folding a SFS removes information about how SNPs are polarized, so that the
Spectrum stores counts of mutations with a given minor allele frequency. To
fold a SFS, we call fold(), which returns a folded Spectrum object.
For example, the standard neutral model of sample size 10,
fs = moments.Demographics1D.snm([10])
fs
Spectrum([-- 1.0 0.4999999999999999 0.33333333333333326 0.25 0.2
 0.16666666666666666 0.14285714285714285 0.125 0.1111111111111111 --], folded=False, pop_ids=None)
can be folded to the minor allele frequency, which updates the allele counts in the minor allele frequency bins and the mask:
fs_folded = fs.fold()
fs_folded
Spectrum([-- 1.1111111111111112 0.6249999999999999 0.4761904761904761
 0.41666666666666663 0.2 -- -- -- -- --], folded=True, pop_ids=None)
When folding multi-dimensional SFS, note that the folding occurs over the global minor allele frequency.
Projecting
SFS projection takes a Spectrum of some sample size and reduces the sample size in one or more populations. The output Spectrum sums over all possible down-samplings so that it is equivalent to having sampled a smaller sample size to begin with.
fs_proj = fs.project([6])
fs_proj
Spectrum([-- 0.9999999999999996 0.49999999999999994 0.33333333333333354
 0.24999999999999994 0.19999999999999996 --], folded=False, pop_ids=None)
For multi-dimensional frequency spectra, we must pass a list of sample sizes of equal length to the dimension of the SFS:
fs = moments.Spectrum(np.random.rand(121).reshape((11, 11)))
fs_proj = fs.project([6, 4])
fs_proj
Spectrum([[-- 1.375001463727314 1.6632602640308294 1.8222587198801135
  1.3320398938892408]
 [1.2449857120736196 1.6320810541272008 1.9865111856949076
  2.136666143165315 1.9991267069609058]
 [1.6212867768713772 1.9353370815393909 1.9003419590313044
  1.8916822482805369 1.9034978374806562]
 [1.642495994701086 1.922825240156728 1.7272904503580018
  1.7937004362855828 1.9652070160175321]
 [1.4914147440468537 1.932207964768191 1.7619391652083913
  1.8764490803992662 1.981163018091177]
 [1.4837136358718945 1.8931045089635383 1.8274863652430493
  1.8655735973654899 2.1990835437766405]
 [1.7443868198621766 1.7092161167033648 2.113098178109875
  2.295218215625108 --]], folded=False, pop_ids=None)
Marginalizing
If a population goes extinct, or if we want to subset a SFS to some focal
populations, we use the marginalize( ) function. This function takes
a list of population indexes as input, and removes those indexes from the
output SFS. The array operation is simply a sum over those axes, but the
marginalization function also preserves population IDs if given.
For example, given a three-population spectrum
fs = moments.Spectrum(np.ones((5, 5, 5)), pop_ids=["A", "B", "C"])
fs
Spectrum([[[-- 1.0 1.0 1.0 1.0]
  [1.0 1.0 1.0 1.0 1.0]
  [1.0 1.0 1.0 1.0 1.0]
  [1.0 1.0 1.0 1.0 1.0]
  [1.0 1.0 1.0 1.0 1.0]]

 [[1.0 1.0 1.0 1.0 1.0]
  [1.0 1.0 1.0 1.0 1.0]
  [1.0 1.0 1.0 1.0 1.0]
  [1.0 1.0 1.0 1.0 1.0]
  [1.0 1.0 1.0 1.0 1.0]]

 [[1.0 1.0 1.0 1.0 1.0]
  [1.0 1.0 1.0 1.0 1.0]
  [1.0 1.0 1.0 1.0 1.0]
  [1.0 1.0 1.0 1.0 1.0]
  [1.0 1.0 1.0 1.0 1.0]]

 [[1.0 1.0 1.0 1.0 1.0]
  [1.0 1.0 1.0 1.0 1.0]
  [1.0 1.0 1.0 1.0 1.0]
  [1.0 1.0 1.0 1.0 1.0]
  [1.0 1.0 1.0 1.0 1.0]]

 [[1.0 1.0 1.0 1.0 1.0]
  [1.0 1.0 1.0 1.0 1.0]
  [1.0 1.0 1.0 1.0 1.0]
  [1.0 1.0 1.0 1.0 1.0]
  [1.0 1.0 1.0 1.0 --]]], folded=False, pop_ids=['A', 'B', 'C'])
we can view the one-population SFS, here the first population:
fs_marg = fs.marginalize([1, 2])
fs_marg
Spectrum([-- 25.0 25.0 25.0 --], folded=False, pop_ids=['A'])
or the joint two-population SFS for population indexes 1 and 2:
fs_marg = fs.marginalize([0])
fs_marg
Spectrum([[-- 5.0 5.0 5.0 5.0]
 [5.0 5.0 5.0 5.0 5.0]
 [5.0 5.0 5.0 5.0 5.0]
 [5.0 5.0 5.0 5.0 5.0]
 [5.0 5.0 5.0 5.0 --]], folded=False, pop_ids=['B', 'C'])
Note that the population IDs stay consistent after marginalizing.
Resampling
We can resample a new SFS from a given Spectrum using two approaches. First,
a standard assumption is that entries in an “expected” SFS give the expectation
of counts within each bin, and data follows a Poisson distribution with rates
equal to the bin values. Then sample() creates a Poisson-sampled SFS:
fs = moments.Demographics1D.snm([10]) * 1000
fs_pois = fs.sample()
fs_pois
Spectrum([-- 988 484 337 271 228 167 152 114 104 --], folded=False, pop_ids=None)
Alternatively, we could resample and enforce that we obtain a SFS with the same number of segregating sites:
fs_fixed = fs.fixed_size_sample(np.rint(fs.S()))
print(f"number of sites in input:", f"{fs.S():.2f}")
print(f"number of sites in resampled SFS:", fs_fixed.S())
fs_fixed
number of sites in input: 2828.97
number of sites in resampled SFS: 2829
Spectrum([-- 1029 538 324 231 194 151 125 120 117 --], folded=False, pop_ids=None)
Demographic events
When defining demographic models with multiple populations, we need to apply demographic events such as population splits, mergers, and admixtures. These operations often change the dimension or size of the SFS, so they do not act in-place. Instead, they return a new Spectrum object, similar to the manipulations in the previous section.
Population splits and branches
New in moments version 1.1, the Spectrum class includes functions to
directly apply demographic events. A population split is called using
fs.split(idx, n0, n1), where the population indexed by idx splits
into n0 and n1 lineages. The split function also takes a
new_ids keyword argument, where we can specify the population IDs of
the two new populations after the split. Note that n0 and n1 cannot
sum to larger than the current sample size of the population that we are
splitting.
For example, to split a single population with 6 tracked lineages into two populations with 3 lineages in each population:
fs = moments.Demographics1D.snm([6])
fs_split = fs.split(0, 3, 3)
fs_split
Spectrum([[-- 0.4999999999999997 0.09999999999999999 0.016666666666666653]
 [0.4999999999999997 0.29999999999999993 0.14999999999999986
  0.049999999999999996]
 [0.09999999999999999 0.14999999999999986 0.14999999999999997
  0.09999999999999995]
 [0.016666666666666653 0.049999999999999996 0.09999999999999995 --]], folded=False, pop_ids=None)
If we use new_ids, we can also keep track of population ids after
a split event:
fs = moments.Demographics2D.snm([6, 2], pop_ids=["A", "B"])
fs
Spectrum([[-- 0.24999999999999994 0.017857142857142853]
 [0.7500000000000001 0.21428571428571433 0.03571428571428571]
 [0.2678571428571428 0.17857142857142852 0.053571428571428506]
 [0.11904761904761908 0.1428571428571428 0.07142857142857138]
 [0.053571428571428506 0.10714285714285701 0.08928571428571426]
 [0.021428571428571408 0.07142857142857144 0.10714285714285715]
 [0.00595238095238095 0.035714285714285705 --]], folded=False, pop_ids=['A', 'B'])
fs_split = fs.split(0, 4, 2, new_ids=["C", "D"])
fs_split
Spectrum([[[-- 0.24999999999999994 0.017857142857142853]
  [0.24999999999999994 0.07142857142857141 0.0119047619047619]
  [0.017857142857142853 0.011904761904761899 0.003571428571428567]]

 [[0.49999999999999994 0.14285714285714285 0.0238095238095238]
  [0.14285714285714285 0.09523809523809523 0.02857142857142854]
  [0.0238095238095238 0.028571428571428543 0.014285714285714268]]

 [[0.10714285714285711 0.0714285714285714 0.0214285714285714]
  [0.0714285714285714 0.0857142857142856 0.0428571428571428]
  [0.0214285714285714 0.042857142857142795 0.0357142857142857]]

 [[0.0238095238095238 0.028571428571428543 0.01428571428571427]
  [0.02857142857142854 0.057142857142857086 0.047619047619047616]
  [0.014285714285714268 0.047619047619047616 0.07142857142857142]]

 [[0.003571428571428567 0.007142857142857133 0.00595238095238095]
  [0.007142857142857134 0.023809523809523805 0.035714285714285705]
  [0.00595238095238095 0.035714285714285705 --]]], folded=False, pop_ids=['C', 'B', 'D'])
As of version 1.1.5, we can apply a “branch” event. This is conceptually similar to a split, but simpler in that a child population branches off from a parental population. In this case, we just need to give the sample size of the new child population (and it’s new population ID), and the parental population is left with the same number of lineages minus the size of the new population, and its population ID (if given) remains unchanged.
fs = moments.Demographics1D.snm([5], pop_ids=["A"])
fs_branch = fs.branch(0, 2, new_id="B")
fs_branch
Spectrum([[-- 0.40000000000000013 0.05000000000000001]
 [0.6000000000000001 0.30000000000000004 0.1]
 [0.15000000000000002 0.2 0.15000000000000002]
 [0.03333333333333334 0.10000000000000003 --]], folded=False, pop_ids=['A', 'B'])
Note
Previous versions of moments required calling functions such as
moments.Manips.split_1D_to_2D(fs, n0, n1) or
moments.Manips.split_3D_to_4D_2(fs, n0, n1).
The new API (fs.split(idx, n0, n1)) wraps the different split functions
in moments.Manips so that we don’t need to worry about picking the
correct split function.
Admixture and mergers
Here, we consider two types of admixture events. First, two populations mix with given proportions to form a new population (which we will call an “admix” event). And second, one population contributes some proportion to another population in the SFS (which we call a “pulse migration” event). In both cases, lineages within the SFS are moved from one or more populations to another, and its size and possibly dimension can change.
To mix two population with a given proportion, we use
fs.admix(idx0, idx1, num_lineages, proportion), where proportion is the
proportion of the new population that comes from population idx0, and 1-proportion
comes from population indexed by idx1. The number of lineages is the sample
size in the new admixed population, and the sample sizes in the source populations
necessarily decrease by that same amount. Note that if the sample size of a source
population equals the number of lineages that are moved, that source population
no longer exists and the dimension decreases by one.
For example, in a two-population SFS, we can look at a few different scenarios of admixture and sample sizes:
fs = moments.Spectrum(np.ones((11, 11)))
print("original SFS has sample size", fs.sample_sizes)
fs_admix = fs.admix(0, 1, 10, 0.25)
print("admix SFS has size", fs_admix.sample_sizes, "after moving 10 lineages")
fs_admix2 = fs.admix(0, 1, 5, 0.5)
print("second admix SFS has size", fs_admix2.sample_sizes, "after moving 5 lineages")
original SFS has sample size [10 10]
admix SFS has size [10] after moving 10 lineages
second admix SFS has size [5 5 5] after moving 5 lineages
And to account for population IDs after admixture:
fs = moments.Spectrum(np.ones((9, 7)), pop_ids=["A", "B"])
print("original SFS has size", fs.sample_sizes, "and pop ids", fs.pop_ids)
fs_admix = fs.admix(0, 1, 4, 0.25, new_id="C")
print("admix SFS has size", fs_admix.sample_sizes, "and pop ids", fs_admix.pop_ids,
    "after moving 4 lineages into new population C")
original SFS has size [8 6] and pop ids ['A', 'B']
admix SFS has size [4 2 4] and pop ids ['A', 'B', 'C'] after moving 4 lineages into new population C
Integration
moments integrates the SFS forward in time by calling fs.integrate( ). At a
minimum, we need to pass the population size(s) nu and the integration time
T. All parameters are scaled by a reference effective population size, so that
time is measured in units of \(2N_e\) generations, sizes are relative to this
same \(N_e\), and mutation and migration rates and the selection coefficient is
scaled by \(2N_e\).
Size functions
The integrate( ) function can take either a list of relative sizes, equal to the
number of populations represented by the SFS, or it can take a function that returns
a list of population sizes over time.
For example, to integrate a two-population SFS with the first population having relative size 2.0 (double the reference size), and the second having size 0.1 (one-tenth the relative size) for 0.05 time units:
fs = moments.Demographics2D.snm([10, 10])
fs.integrate([2.0, 0.1], 0.05)
To specify a size function that changes over time, for example an exponential growth model, we can instead pass a size function to the integration method:
fs = moments.Demographics1D.snm([10])
nu0 = 0.5
nuF = 2.0
T = 0.2
nu_func = lambda t: [nu0 * np.exp(np.log(nuF / nu0) * t / T)]
print("size at start of epoch:", nu_func(0))
print("size at end of epoch:", nu_func(T))
fs.integrate(nu_func, T)
size at start of epoch: [0.5]
size at end of epoch: [1.9999999999999996]
Integration time and time units
Unlike coalescent simulators, such as msprime, integration times in moments
are in units of \(2N_e\) generations. Thus, typical integration times for many
demographic scenarios could be much smaller than one.
Times are not cummulative when integrating multiple epochs - each time integrate( )
is called, internally time starts from zero by default. Thus, when defining multiple
epochs with size functions, keep in mind that time for that epoch runs from zero to the
integration time T.
Migration rates
Migration between populations is specified by the migration matrix, with has shape
\(p \\times p\), where \(p\) is the number of populations represented by the
SFS. The \(i\)-th row of the migration matrix gives the migration rates from
each other population into the population indexed by \(i\). Because rates are
rescaled by the effective population size, the entry M[i, j] gives the migration
rate 2*Ne*m_ij, where m_ij is the per-generation probability of a lineage
in population i having its parent in population j. Note that the diagonal
elements of M are ignored.
For example, to integrate a two-population SFS with migration:
fs = moments.Demographics2D.snm([10, 10])
M = np.array([
    [0, 2.0],
    [0.75, 0]
])
fs.integrate([2, 3], 0.05, m=M)
Mutation rates and mutation model
By default, moments uses an infinite-sites model (ISM). Then the mutation rate
\(\theta\) is the population-size scaled mutation rate multiplied by the number
of loci: theta = 4*Ne*u*L. By default, theta is set to 1.
Luckily, we do not often need to worry about setting theta, because the ISM
guarantees that the expected count in each frequency bin of the SFS scales linearly
in the mutation rate. This means that we can happily integrate with the default
theta and only rescale the SFS at the end:
theta = 100
fs_theta = moments.LinearSystem_1D.steady_state_1D(20) * 100
fs_theta = moments.Spectrum(fs_theta)
fs_theta.integrate([2.0], 0.1, theta=theta)

fs = moments.Demographics1D.two_epoch((2.0, 0.1), [20]) # default theta = 1
fs = theta * fs

print(fs_theta.S())
print(fs.S())
395.6948077081298
395.69480770813
Reversible mutations
Unlike dadi, which solves the diffusion equation directly and can only
simulate under the ISM, the moments-based engine in moments lets us
accurately track the density of the “fixed” bins. That is, we can compute
not just the distribution of segregating mutation frequencies, but also the
probability that a locus is monomorphic in a sample for the derived or
ancestral allele.
To compute a SFS in which we track monomorphic loci, we use a reversible mutation
model, which we specify by setting finite_genome=True. When simulating under
the finite genome model, the mutation rate is no longer scaled by the number of
loci, L. Instead, the mutation rates are simply theta_fd=4*Ne*u and
theta_bd=4*Ne*v where u and v are the forward and backward mutation rates,
respectively. Therefore, theta_fd and theta_bd are typically much less than
1 (and in fact the model breaks down for scaled mutation rates around 1).
To simulate under the reversible mutation model, we first initialize the
steady-state SFS with mask_corners=False, and then apply demographic events
as normal and integrate using finite_genome=True:
theta_fd = 0.0005 # 4*Ne*u, with Ne = 1e4 and u = 1.25e-8
theta_bd = 0.001 # the backward mutation rate is double the forward rate
fs = moments.LinearSystem_1D.steady_state_1D_reversible(
    20, theta_fd=theta_fd, theta_bd=theta_bd) # sample size = 20
fs = moments.Spectrum(fs, mask_corners=False)

fs.integrate(
    [5.0], 0.2, finite_genome=True, theta_fd=theta_fd, theta_bd=theta_bd)
Note that if the forward and backward mutation rates are equal, we can use theta
to set both mutation rates (which must be set, as theta must be less than 1).
Illustration: ancestral state misidentification
In SFS analyses, a typical confounder is the misidentification of the ancestral allele. This occurs because polarization requires estimating the ancestral state of a locus, which is typically done by comparing to one or more outgroup species in a sequence alignment. For humans, we typically use chimpanzee and other great apes to infer the ancstral allele.
At longer evolutionary timescales, it is not uncommon for multiple independent mutations to occur at the same locus, so that when comparing to an outgroup species we classify some derived mutations as ancestral and some ancestral mutations as derived. For humans, the rate of ancestral misidentification is typically in the 1-3% range, depending on the method used to polarize alleles.
For example, we can simulate using rough parameters (\(u=1.25\times 10^{-8}\), \(N_e=10^4\), divergence of 6 million years, and a generation time of 25 years) and symmetric mutation rates to see the effect of polarizing based on the allele in a chimp sequence. Here, if the chimp carries the derived allele, we will instead assume the ancestral allele is derived:
Ne = 1e4
u = 1.25e-8
theta = 4 * Ne * u
generation_time = 25
divergence_years = 6e6
T = divergence_years / generation_time / 2 / Ne

fs = moments.LinearSystem_1D.steady_state_1D_reversible(
    101, theta_fd=theta, theta_bd=theta)
fs = moments.Spectrum(fs, mask_corners=False)

fs = fs.split(0, 100, 1)
fs.integrate([1, 1], T, finite_genome=True, theta=theta)

fs_polarized = fs[:,0] + fs[::-1,1]
fs_polarized.mask_corners()
Then visualizing using moments.Plotting.plot_1d_fs(fs_polarized), we can see
the uptick at high-frequency variants due to ancestral misidentification - that is,
recurrent mutations along the lineage leading from humans to chimps:
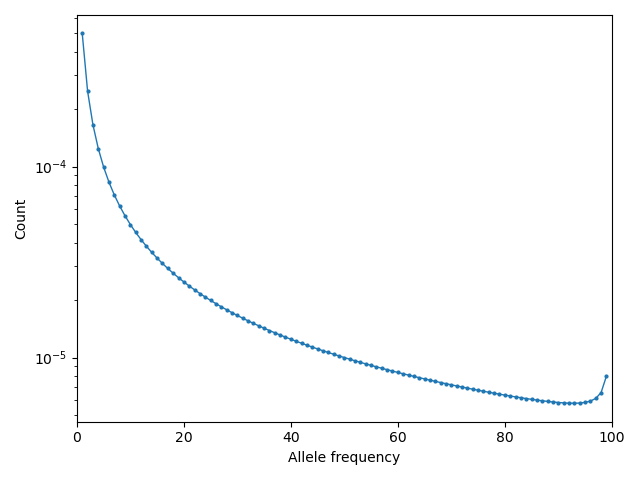
Fig. 1 Excess of high-frequency derived mutations due to ancestral misspecification.
Selection and dominance
One of the great benefits to forward simulators is their ability to include the
effects of selection and dominance with little extra cost. In the selection
model implemented in moments, genotype fitnesses are given relative to the
ancestral homozygous genotype (i.e. relative fitness of aa is 1), so that
heterozygous genotypes (Aa) have relative fitness \(1+2hs\) and
homozygous derived genotypes (AA) have relative fitness \(1+2s\).
When \(h=1/2\), selection is additive (or genic), which corresponds to
haploid copies of the derived allele having average fitness \(1+s\). If
h is unspecified, the selection model defaults to additivity
(\(h=1/2\)), and if gamma is unspecified, we default to neutrality.
Note
We assume \(|s| \ll 1\), so that \(s^2\) and higher order terms can be ignored. For strong selection in a moments framework, see recent advances from [Krukov2021].
moments takes scaled selection coefficients \(\gamma = 2 N_e s\) and
dominance coefficients \(h\) as keyword parameters when initializing the
SFS and integrating. The reference \(N_e\) is often taken as the ancestral
effective population size.
gamma = -5
h = 0.1
ns = 30

fs = moments.LinearSystem_1D.steady_state_1D(ns, gamma=gamma, h=h)
fs = moments.Spectrum(fs)
print("Tajima's D (before expansion):", fs.Tajima_D())

fs.integrate([3], 0.2, gamma=gamma, h=h)
print("Tajima's D (after expansion):", fs.Tajima_D())
Tajima's D (before expansion): -0.643870774090141
Tajima's D (after expansion): -1.1502872304492777
Simulating selection with multiple populations works similarly. We can specify
gamma and h as scalar values, which implies that the allele has the
same selection and dominance effect in each population. We can instead simulate
population-specific selection and dominance coefficients by setting gamma
and/or h as a list of length equal to the number of populations in the
spectrum, with indexing matching the ordering of the populations in the
spectrum object.
Ancient samples and frozen populations
So far, in all the examples we’ve seen the output SFS integrates all populations
until the same end time. If one or more of the sampled populations are
non-contemporary, we need to “freeze” those populations at their time of sampling.
This is done by specifying which populations to freeze using the frozen
argument.
For example, if we sample two populations that split 100kya, and one population consisting of ancient samples from 20kya, we integrate the first 80 thousand years as normal, and then the last 20 thousand years with the ancient population frozen:
Ne = 1e4
generation_time = 25
T1 = 80e3 / 2 / Ne / generation_time
T2 = 20e3 / 2 / Ne / generation_time
migrate = 0.5

fs = moments.Demographics2D.snm([10, 10])
fs.integrate([1, 1], T1, m=[[0, migrate], [migrate, 0]])
fs.integrate([1, 1], T1, m=[[0, migrate], [migrate, 0]], frozen=[False, True])
Computing summary statistics
moments allows us to compute a handful of summary statistics from the SFS.
For single populations, we can get Watterson’s \(\theta\), the diversity
\(\pi\), or Tajima’s \(D\) directly from the SFS:
fs = moments.Demographics1D.two_epoch((3.0, 0.2), [20])
print("Watterson's theta:", fs.Watterson_theta())
print("Diversity:", fs.pi())
snm = moments.Demographics1D.snm([20])
print("Tajima's D at steady state:", snm.Tajima_D())
print("Tajima's D after expansion:", fs.Tajima_D())
Watterson's theta: 1.291270898392208
Diversity: 1.128986048415916
Tajima's D at steady state: 3.1116722926989843e-16
Tajima's D after expansion: -0.37656997453348207
For multi-population spectra, we can also compute FST using Weir and Cokerham’s (1984) method, which generalizes to any number of populations greater than one:
fs = moments.Demographics2D.snm([10, 10])
print("FST immediately after split:", fs.Fst())
fs.integrate([1, 1], 0.05)
print("FST after isolation of 0.05*2*Ne gens:", fs.Fst())
fs.integrate([1, 1], 0.05)
print("FST after isolation of 0.1*2*Ne gens:", fs.Fst())
FST immediately after split: 0.05263157894736842
FST after isolation of 0.05*2*Ne gens: 0.09774436090225562
FST after isolation of 0.1*2*Ne gens: 0.13875598086124397
Note that FST is sensitive to sample sizes: smaller sample sizes artificially inflate the “true” divergence.
print("10 samples each:", moments.Demographics2D.snm([10, 10]).Fst())
print("100 samples each:", moments.Demographics2D.snm([100, 100]).Fst())
10 samples each: 0.05263157894736842
100 samples each: 0.005025125628140709
Compute SFS from VCF
moments supports computing a SFS from files in VCF format, given a
population information file. This takes two steps. We first parse the VCF
using and we then pass that data dictionary to the Spectrum class:
data_dict = moments.Misc.make_data_dict_vcf(vcf_filename, popinfo_filename)
fs = moments.Spectrum.from_data_dict(data_dict)
Plotting the SFS
moments comes pre-installed with a number of plotting functions, which can be
called from moments.Plotting. These include functions to plot individual
SFS, or to compare two SFS (for example, to compare a model to data). These
functions can be used out-of-the-box, or serve as inspiration for your own
matplotlib adventures. To see what plotting functions are available and view
their documentation, head to the moments API.
References
Jouganous, Julien, et al. “Inferring the joint demographic history of multiple populations: beyond the diffusion approximation.” Genetics 206.3 (2017): 1549-1567.
Krukov, Ivan, and Simon Gravel. “Taming strong selection with large sample sizes.” bioRxiv (2021), doi: 10.1101/2021.03.30.437711.